

A major theme during the 2018 election in both the House and Senate was the popularity of
Question:
A major theme during the 2018 election in both the House and Senate was the popularity of President Trump (a Republican). The scatter diagram below shows the presidential approval rating (percent of registered voters who approve of the job the president is doing) versus the percentage of votes received by the Democratic senatorial candidate in the 2018 election.
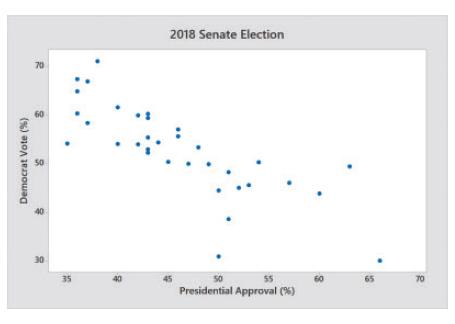
(a) What type of relation appears to exist between presidential approval ratings and percentage of Democrat votes?
(b) There are 34 observations in the data set. The correlation between presidential approval and percent Republicans is -0.781. Does this suggest a linear relation exists between presidential approval and percent Republican? Use n = 30 from Table II.
(c) The least-squares regression line treating presidential approval, x, as the explanatory variable and percent Democrat as the response variable, y, is Y̆ = -0.9147x + 94.9933. Interpret the slope. What does this say about candidates of the same party as the president in Senate elections?
(d) Does it make sense to interpret the intercept? Why or why not?
(e) If President Trump’s approval rating was 50%, what would you expect the percent of votes for the Democrat candidat to be?
(f) What would President Trump’s approval rating need to be in order for the Democrat candidate to expect to receive 50 of the vote? Round your answer to the nearest tenth of a percent.
(g) In Wisconsin, Tammy Baldwin (a Democrat) won the election with 55.4% of the vote; President Trump’s approval rating was 43%. Did Baldwin get a higher percent of the votes than would be expected for this presidential approval rating?
Step by Step Answer:
a According to the scatterplot there is a negative linear association between presidential approval ...View the full answer


