

Question: Determine whether or not the histogram indicates that a normal distribution could be used as a model for the variable. The relative frequency histogram represents
Determine whether or not the histogram indicates that a normal distribution could be used as a model for the variable.
The relative frequency histogram represents the waiting times (in minutes) to ride the American Eagle Roller Coaster for 2000 randomly selected people on a Saturday afternoon in the summer.
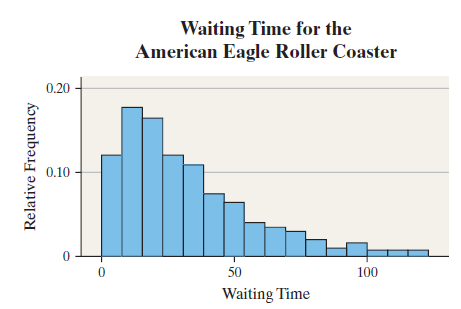
Waiting Time for the American Eagle Roller Coaster 0.20 0.10 50 100 Waiting Time Relative Frequency
Step by Step Solution
★★★★★
3.39 Rating (168 Votes )
There are 3 Steps involved in it
1 Expert Approved Answer
Step: 1 Unlock

The histogram is ske... View full answer
Question Has Been Solved by an Expert!
Get step-by-step solutions from verified subject matter experts
Step: 2 Unlock
Step: 3 Unlock
Document Format (2 attachments)
1509_6092e13eb7f0a_682653.pdf
180 KBs PDF File
1509_6092e13eb7f0a_682653.docx
120 KBs Word File