

Question: Do people cheat or lie when cheating or lying is not easy to identify (such as filing of taxes)? A total of 2568 college-aged subjects
Do people cheat or lie when cheating or lying is not easy to identify (such as filing of taxes)? A total of 2568 college-aged subjects from various countries throughout the world rolled a single six-sided die twice. The subjects were told that the first roll counted in determining a reward and the second roll was only to determine whether the die was “working properly.” Rewards were as follows: rolling a one meant earning 1 unit of the local currency (such as $1), rolling a two meant earning 2 units, and so on—except that rolling a six meant earning nothing. The rolling was done unsupervised (although results were secretly recorded) with the subjects free to report the outcomes of their respective rolls of the die (thereby creating an opportunity to cheat or lie about the outcome).
(a) If individuals do not lie about the outcome of the first roll of the die, what would you expect the distribution of outcomes to be? The following distribution represents the outcomes based on the results reported in the study. The row “First Roll Frequency” represents the frequency each first roll resulted in the given outcome. The row “Reported Frequency” represents the outcome reported by the subjects.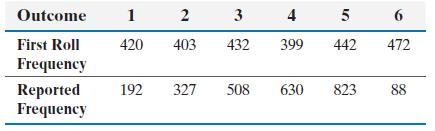
(b) Does the first roll frequency distribution conform to the model we would expect if individuals do not lie about the outcome? Use an α = 0.05 level of significance.
(c) Does the reported frequency distribution conform to the model we would expect if individuals do not lie about the outcome? Use an α = 0.05 level of significance.
(d) The following probability distribution represents the outcomes under the assumption the subjects are choosing the better outcome in the two rolls. For example, if the subject first rolls a two, then a four, the subject would simply report the four. Does the reported frequency distribution given above suggest subjects were choosing the better outcome?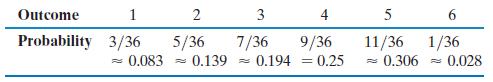
(e) What does your data analysis suggest?
Outcome First Roll Frequency Reported Frequency 1 2 420 403 192 3 432 4 399 327 508 630 5 442 823 6 472 88
Step by Step Solution
3.44 Rating (167 Votes )
There are 3 Steps involved in it
a H 0 p 1 p 2 p 3 p 4 p 5 p ... View full answer

Get step-by-step solutions from verified subject matter experts