

Question: In Example 4 ( Section 2 ), we used the two-sample t -statistic to compare the mean reading scores of two groups of slow learners
In Example 4 ( Section 2 ), we used the two-sample t -statistic to compare the mean reading scores of two groups of “slow learners” who had been taught to read by two different methods. The data are repeated in Table 10 for convenience. The use of the t -statistic was based on the assumption that the population variances of the test scores were equal for the two methods. Conduct a test of hypothesis to check this assumption at a = .10.
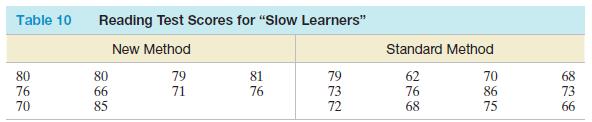
Table 10 Reading Test Scores for "Slow Learners" New Method Standard Method 80 76 3280 70 588 80 66 85 77 79 81 71 76 222 79 73 72 823 62 76 68 7010 86 75 328 68 73 66
Step by Step Solution
There are 3 Steps involved in it

Get step-by-step solutions from verified subject matter experts