

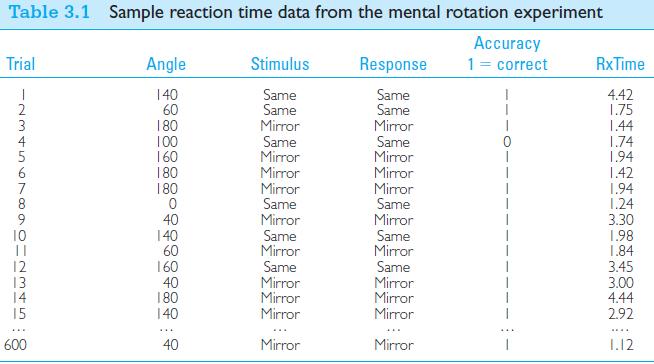
In Table 3.1 the reaction-time data are broken down by the degrees of rotation separating the objects.
Question:
In Table 3.1 the reaction-time data are broken down by the degrees of rotation separating the objects. (You may want to sort the data by this variable.) Use SPSS or another computer program to plot separate histograms of these data as a function of the Angle of rotation. (You can do it in R, but it requires things you don’t yet know. See the Web page for this chapter.) These data are available at https://www.uvm.edu/~dhowell/fundamentals9/DataFiles/MentalRotation.dat
Step by Step Answer:

This question has not been answered yet.
You can Ask your question!
Related Book For 
Fundamental Statistics For The Behavioral Sciences
ISBN: 9781305652972
9th Edition
Authors: David C. Howell
Question Posted:
