

The following data represent the speed at which a ball was hit (in miles per hour) and
Question:
The following data represent the speed at which a ball was hit (in miles per hour) and the distance it traveled (in feet) for a random sample of home runs in a Major League baseball game.
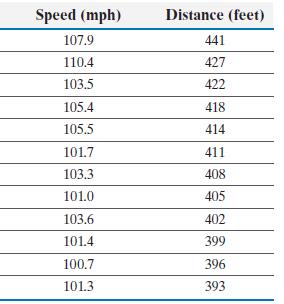
(a) Find the least-squares regression line treating speed at which the ball was hit as the explanatory variable and distance the ball traveled as the response variable.
(b) Interpret the slope and y-intercept, if appropriate.
(c) Predict the mean distance of all home runs hit at 105 mph.
(d) If a ball is hit with a speed of 105 miles per hour, predict how far it will travel.
(e) Christian Yelich hit a home run 398 feet. The speed at which the ball was hit was 106.2 mph. Did this ball travel farther than you would have predicted? Explain.
(f) Would you feel comfortable using the least-squares regression model on home runs where the speed of the ball was 122 mph? Explain.
Step by Step Answer:
a We computed the correlation coefficient Rounded to seven decimal places it is r08229755 We comp...View the full answer


