

The following data represent the total compensation for 12 randomly selected chief executive officers (CEO) and the
Question:
The following data represent the total compensation for 12 randomly selected chief executive officers (CEO) and the company’s stock performance in 2017.
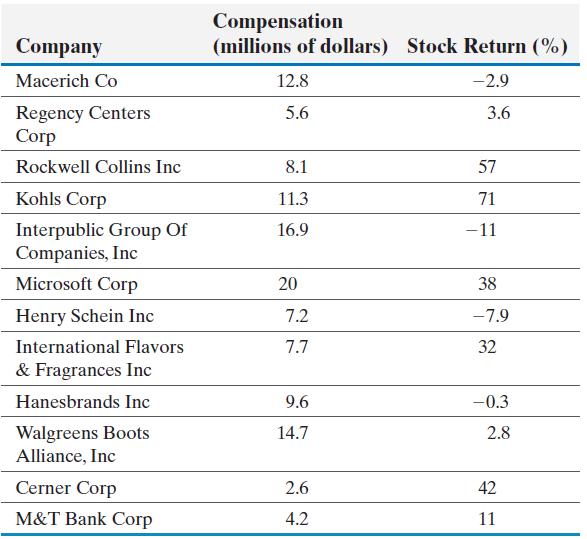
(a) One would think that a higher stock return would lead to a higher compensation. Based on this, what would likely be the explanatory variable?
(b) Draw a scatter diagram of the data.
(c) Determine the linear correlation coefficient between compensation and stock return.
(d) Does a linear relation exist between compensation and stock return? Does stock performance appear to play a role in determining the compensation of a CEO?
Fantastic news! We've Found the answer you've been seeking!
Step by Step Answer:
a The explanatory variable is stock return b c To calculate ...View the full answer

Answered By
Rishabh Ojha
During my undergraduate i used to participate as TA (Teaching Assistant) in several electronics and computers subject. I'm passionate about learning Computer Science as my bachelors are in Electronics but i learnt most of the Computer Science subjects on my own which Machine Learning also. At Present, i'm a working professional pursuing my career as a Machine Learning Engineer and i want to help others learn during my free hours, that's all the motivation behind giving tuition. To be frank i have no prior experience of tutoring but i have solved problems on opensource platforms like StackOverflow and github. ~Thanks
3+ Reviews
10+ Question Solved
Related Book For 

Question Posted:
