

The following dot plot drawn in Minitab shows the number of people living in a household for
Question:
The following dot plot drawn in Minitab shows the number of people living in a household for a random sample of households in the United States.
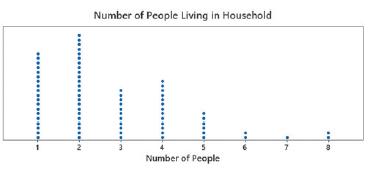
(a) If you randomly selected a household, what is the most likely number of people living in the household?
(b) If you randomly selected a household, what is the least likely number of people living in the household?
(c) How many households in the sample had five people living in the household?
(d) How many more households have four people living in the household than three?
Fantastic news! We've Found the answer you've been seeking!
Step by Step Answer:
a 2 b ...View the full answer

Answered By
Muhammad Umair
I have done job as Embedded System Engineer for just four months but after it i have decided to open my own lab and to work on projects that i can launch my own product in market. I work on different softwares like Proteus, Mikroc to program Embedded Systems. My basic work is on Embedded Systems. I have skills in Autocad, Proteus, C++, C programming and i love to share these skills to other to enhance my knowledge too.
1+ Reviews
10+ Question Solved
Related Book For 

Question Posted:
