

The following frequency distribution represents the birth weight of all babies born in the United States in
Question:
The following frequency distribution represents the birth weight of all babies born in the United States in 2017.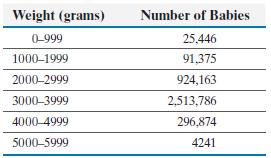
(a) Approximate the mean and standard deviation birth weight.
(b) Draw a frequency histogram of the data to verify that the distribution is bell-shaped.
(c) According to the Empirical Rule, 68% of all babies will weigh between what two values?
Fantastic news! We've Found the answer you've been seeking!
Step by Step Answer:
a To find the mean we use the formula To find the standard deviation we choose to u...View the full answer

Answered By
Wahome Michael
I am a CPA finalist and a graduate in Bachelor of commerce. I am a full time writer with 4 years experience in academic writing (essays, Thesis, dissertation and research). I am also a full time writer which assures you of my quality, deep knowledge of your task requirement and timeliness. Assign me your task and you shall have the best.
Thanks in advance
63+ Reviews
132+ Question Solved
Related Book For 

Question Posted:
