

Use R to reproduce display Figure 3.4 as a boxplot instead of back-to-back stem-and-leaf displays. The command
Question:
Use R to reproduce display Figure 3.4 as a boxplot instead of back-to-back stem-and-leaf displays.
The command is boxplot(y ~ x), where “~” is read “as a function of” and x and y are the relevant variables. Just experiment.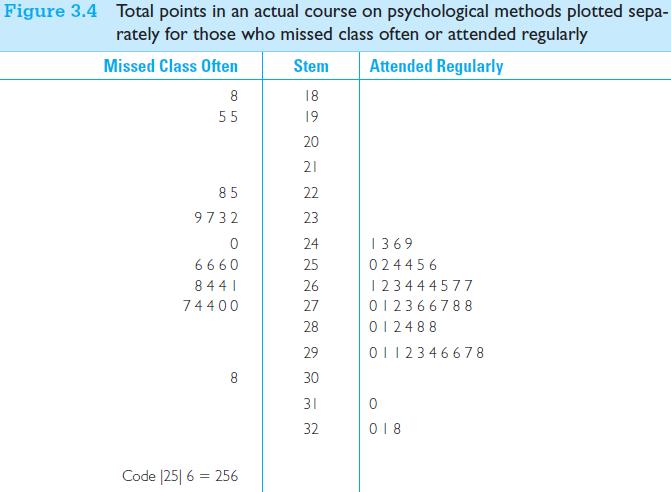
Fantastic news! We've Found the answer you've been seeking!
Step by Step Answer:

Answered By
Sultan Ghulam Dastgir
The following are details of my Areas of Effectiveness English Language Proficiency, Organization Behavior , consumer Behavior and Marketing, Communication, Applied Statistics, Research Methods , Cognitive & Affective Processes, Cognitive & Affective Processes, Data Analysis in Research, Human Resources Management ,Research Project,
Social Psychology, Personality Psychology, Introduction to Applied Areas of Psychology,
Behavioral Neurosdence , Historical and Contemporary Issues in Psychology, Measurement in Psychology, experimental Psychology,
1+ Reviews
10+ Question Solved
Related Book For 
Fundamental Statistics For The Behavioral Sciences
ISBN: 9781305652972
9th Edition
Authors: David C. Howell
Question Posted:
