

Question: Use the frequency distribution whose class width is 0.5 obtained in Problem 30 in Section 2.2 to approximate the mean and standard deviation for cigarette
Use the frequency distribution whose class width is 0.5 obtained in Problem 30 in Section 2.2 to approximate the mean and standard deviation for cigarette tax rates. Compare these results to the actual mean and standard deviation.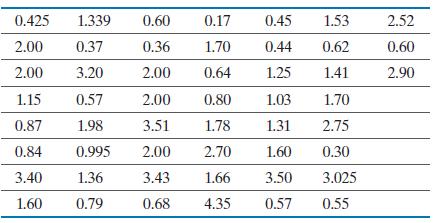
0.425 1.339 2.00 0.37 2.00 3.20 1.15 0.57 0.87 1.98 0.84 0.995 3.40 1.36 1.60 0.79 0.60 0.36 2.00 2.00 3.51 2,00 3.43 0.68 0.17 0.45 1.70 0.64 1.53 0.44 0.62 1.25 1.41 1.03 1.70 1.31 2.75 1.60 0.30 3.50 3.025 0.57 0.55 0.80 1.78 2.70 1.66 4.35 2.52 0.60 2.90
Step by Step Solution
3.43 Rating (169 Votes )
There are 3 Steps involved in it
We organize our computations in the tables that fo... View full answer

Get step-by-step solutions from verified subject matter experts