

Using the data from Exercise 16.29 a) Calculate 2 and 2 . b) Why do
Question:
Using the data from Exercise 16.29
a) Calculate η2 and ω2.
b) Why do the two estimates of the magnitude of effect in part
a) differ?
c) Calculate a measure of ![]() , using the most appropriate groups.
, using the most appropriate groups.
Exercise 16.29
Langlois and Roggman (1990) took facial photographs of males and females. They then created five groups of composite photographs by computer-averaging the individual faces. For one group the computer averaged 32 randomly selected same-gender faces, producing a quite recognizable face with average width, height, eyes, nose length, and so on. For the other groups the composite faces were averaged over either 2, 4, 8, or 16 individual faces. Each group saw six separate photographs, all of which were computer-averaged over the appropriate number of individual photographs. Langlois and Roggman asked participants to rate the attractiveness of the faces on a 1–5 scale, where 5 represents “very attractive.” The data have been constructed to have the same means and variances as those reported by Langlois and Roggman.
Data on rated attractiveness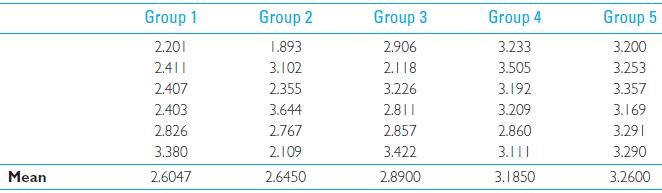
Step by Step Answer:


Fundamental Statistics For The Behavioral Sciences
ISBN: 9781305652972
9th Edition
Authors: David C. Howell
