

Using the data on self-enhancement given in Exercise 10.16, add two scores to each year, keeping the
Question:
Using the data on self-enhancement given in Exercise 10.16, add two scores to each year, keeping the year mean unchanged. (For example, if the 1982 mean SelfEn score was 0.40, you could make two other scores for that year by adding and subtracting .03 from 0.40.) This will give you 31 × 3 = 93 pairs of scores. Now compute the correlation and regression of SelfEn predicted from Year. Why does the correlation differ from the r = .57 computed in Exercise 10.16? What has happened to the slope, and why?
Exercise 10.16
In the chapter we saw a study by Trzesniewski et al. (2008) on trends in narcissism scores over time. They also reported data on self-enhancement, which is the tendency to hold unrealistically positive views of oneself. The measure of self-enhancement (SelfEn) was obtained by asking students to respond on a 1–10 scale rating their intelligence relative to others.
The researchers then calculated the difference between the rating predicted from SAT scores and the rating the student gave. The data are presented below. Positive scores represent self-enhancement.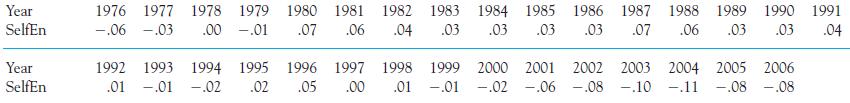
a) From these data can we say something about what changes have taken place in self enhancement scores of college students over the years?
b) With several hundred thousand students in the combined sample, the authors of the original study actually based their analyses on individual scores rather than yearly means to make the same computation. They found a correlation of 2.03, which differs considerably from your result. Why is this not surprising?
c) Which is the correct correlation for this question (yours or the authors’), or are they both correct?
Step by Step Answer:


Fundamental Statistics For The Behavioral Sciences
ISBN: 9781305652972
9th Edition
Authors: David C. Howell
