

Wainer (1997) presented data on the relationship between hours of TV watching and mean scores on the
Question:
Wainer (1997) presented data on the relationship between hours of TV watching and mean scores on the 1990 National Assessment of Educational Progress (NAEP) for eighth-grade mathematics assessment. The data follow, separated for boys and girls.
a) Plot the relationship between Hours Watched and NAEP Mathematics scores separately for boys and girls (but put them on the same graph).
b) Find and interpret the slope and intercept for these data, again keeping boys and girls separate.
c) We know from other data that boys spend more time watching television than girls do.
Could this be used as an explanation of performance differences between boys and girls?
The R code for these plots is 10.28 You probably were startled to see the very neat relationships in Exercise 10.27. There was almost no variability about the regression line. I would, as a first approximation, guess that the relationship between television hours watched and standardized test performance would contain roughly as much scatter as the relationship between stress and symptoms, yet these data are far neater than the data in Figure 10.1. What might have caused this?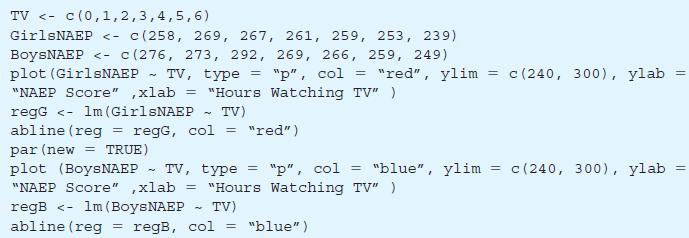
Step by Step Answer:

This question has not been answered yet.
You can Ask your question!

Fundamental Statistics For The Behavioral Sciences
ISBN: 9781305652972
9th Edition
Authors: David C. Howell
