

Question: Which box plot likely has the data with a larger standard deviation? Why? I. II. + 5 25 + 30 10 15 20
I.

II.
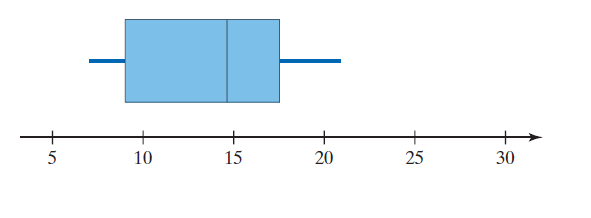
+ 5 25 + 30 10 15 20
Step by Step Solution
★★★★★
3.52 Rating (152 Votes )
There are 3 Steps involved in it
1 Expert Approved Answer
Step: 1 Unlock

Box plot II likely ha... View full answer
Question Has Been Solved by an Expert!
Get step-by-step solutions from verified subject matter experts
Step: 2 Unlock
Step: 3 Unlock
Document Format (2 attachments)
1509_6092e13eb53ad_682465.pdf
180 KBs PDF File
1509_6092e13eb53ad_682465.docx
120 KBs Word File