

Question: Reconsider Prob. 1879. Using an appropriate software, plot the soil temperature as a function of the distance from the earths surface as the distance varies
Data from 18-79
The soil temperature in the upper layers of the earth varies with the variations in the atmospheric conditions. Before a cold front moves in, the earth at a location is initially at a uniform temperature of 10°C. Then the area is subjected to a temperature of €“ 10°C and high winds that resulted in a convection heat transfer coefficient of 40 W/m2·K on the earth€™s surface for a period of 10 h. Taking the properties of the soil at that location to be k = 0.9 W/m · K and α = 1.6 × 10€“5 m2/s, determine the soil temperature at distances 0, 10, 20, and 50 cm from the earth€™s surface at the end of this 10-h period.
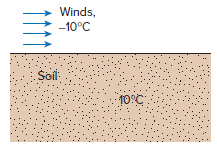
Winds, -10C Soil: 10C"
Step by Step Solution
3.55 Rating (165 Votes )
There are 3 Steps involved in it
Prob 1879 is reconsidered The soil temperature as a func... View full answer

Get step-by-step solutions from verified subject matter experts