

Reconsider Prob. 5113. Using EES (or other) software, plot the temperature at the top corner as a
Question:
Reconsider Prob. 5–113. Using EES (or other) software, plot the temperature at the top corner as a function of heating time as it varies from 2 min to 30 min, and discuss the results.
Data from problem 113
Consider two-dimensional transient heat transfer in an L-shaped solid bar that is initially at a uniform temperature of 140°C and whose cross section is given in the figure. The thermal conductivity and diffusivity of the body are k 5 15 W/m · K and α = 3.2 × 10⁻⁶ m2/s, respectively, and heat is generated in the body at a rate of ė = 2 × 10⁷ W/m3. The right surface of the body is insulated, and the bottom surface is maintained at a uniform temperature of 140°C at all times. At time t = 0, the entire top surface is subjected to convection with ambient air at T∞ = 25°C with a heat transfer coefficient of h = 80 W/m2 · K, and the left surface is subjected to uniform heat flux at a rate of q̇L = 8000 W/m2. The nodal network of the problem consists of 13 equally spaced nodes with Δx = Δy = 1.5 cm. Using the explicit method, determine the temperature at the top corner (node 3) of the body after 2, 5, and 30 min.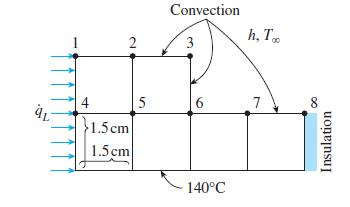
Step by Step Answer:

This question has not been answered yet.
You can Ask your question!

Heat And Mass Transfer Fundamentals And Applications
ISBN: 9780073398181
5th Edition
Authors: Yunus Cengel, Afshin Ghajar
