

The line graph shows the regular season attendance (in millions) for three professional sports organizations from 1985
Question:
The line graph shows the regular season attendance (in millions) for three professional sports organizations from 1985 to 2000.
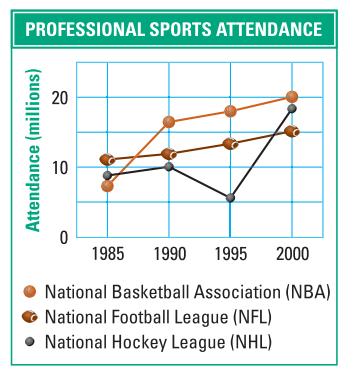
a. During which five-year period did the NBA attendance increase the most? Estimate the rate of change for this five-year period in people per year.
b. During which five-year period did the NHL attendance increase the most? Estimate the rate of change for this five-year period in people per year.
c. Interpret The line graph for the NFL seems to be almost linear between 1985 and 2000. Write a sentence about what this means in terms of the real-world situation.
Fantastic news! We've Found the answer you've been seeking!
Step by Step Answer:
Based on the given graph we can answer the questions a During 198...View the full answer

Answered By
Gloria Joseph
Hi,
I am a tutor in Mathematics subject. I love learning and teaching too. I understand that each student is unique and hence I need to change myself - while communicating with each one of the students - so as to make the activity of learning a play thing, once and then for ever!
I believe in activity-based learning, with the help of tools/games/students participating in events- especially outdoor ones. I also believe in continuous learning and teaching to keep myself up to date!
Cheers!!
0 Reviews
10+ Question Solved
Related Book For 
Holt McDougal Larson Geometry
ISBN: 9780547315171
1st Edition
Authors: Ron Larson, Laurie Boswell, Timothy D. Kanold, Lee Stiff
Question Posted:
