

It is June, and the manager of the retail chain Stapleton wants to increase revenues during the
Question:
It is June, and the manager of the retail chain Stapleton wants to increase revenues during the back-to-school period. To do that, he plans to attract more customers in August whose children are entering school for the first time. By marketing to households who have kids entering school for the first time, Stapleton expects these households will purchase more products from Stapleton throughout the year. His question for the data science team is how to identify and target those households.
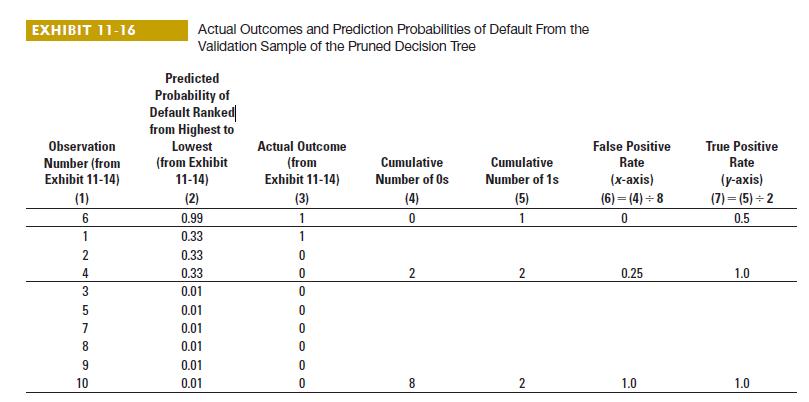
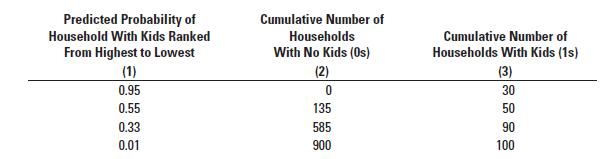
Caitlin Finch is the management accountant assigned to the project. The data science team has built a predictive model. The nodes of the decision tree result in four possible prediction probabilities (0.99, 0.55, 0.33, and 0.01). The validation sample of 1,000 records comprises 100 households with a child going to school for the first time and 900 households with no children going to school for the first time. The team prepares the following table, like the one in Exhibit 11-16. The table orders the predicted probabilities of households having kids entering school for the first time ranked from highest to lowest (as in Exhibit 11-16, column 2) based on the model, the cumulative number of households with no kids entering school for the first time (as in Exhibit 11-16, column 4), and the cumulative number of households with kids entering school for the first time (as in Exhibit 11-16, column 5). To ease exposition, we refer to households with kids entering school for the first time as “Households With Kids” or simply as “Kids” and households with no kids entering school for the first time as “Households With No Kids” or simply as “No Kids.” This means, for example, that at a cutoff probability of 0.50, the model would correctly predict 50 households with kids entering school for the first time but also incorrectly predict 135 households with kids entering school for the first time when those households do not have kids entering school for the first time.
Required
1. Calculate the false positive rate and true positive rate for the above table as in Exhibit 11-16, columns 6 and 7.

2. Draw the ROC curve. Would you recommend using this ROC curve to make predictions about households with kids entering school for the first time?
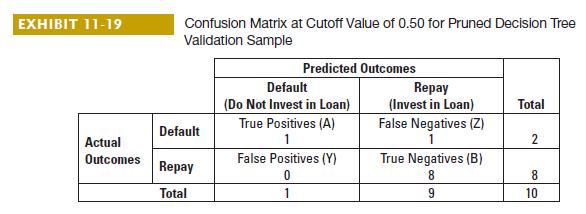
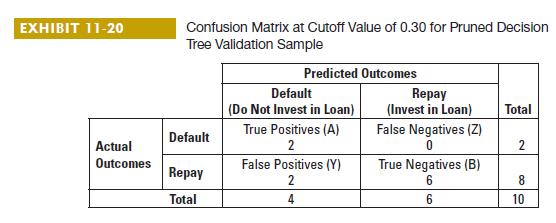
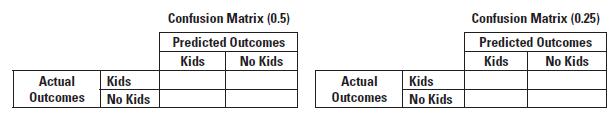
3. Use the preceding table to determine how many true positives and false positives the model identifies at a cutoff of 0.25 and 0.50. Fill in the confusion matrices below as in Exhibits 11-19 and 11-20.
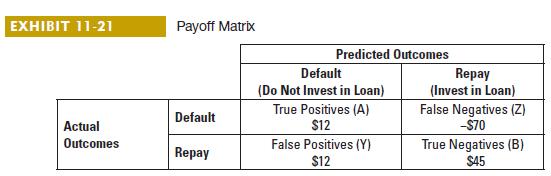
4. For those households predicted to have kids going to school for the first time, Stapleton will spend $2 promoting products to each household. Stapleton expects to make $25 (after taking into account the $2 spent on promotion) from those households that it correctly identifies as having kids. Without doing promotion, Stapleton will earn an average of $10 from every household with a kid entering school for the first time. Using this information, create a payoff matrix as in Exhibit 11-21 and determine whether Caitlin should use a cutoff probability of 0.5 or 0.25.
 5. When might a large increase in false positives be acceptable to Stapleton if the number of true positives also increases?
Step by Step Answer:
ANSWER 1To calculate the false positive rate and true positive rate we can refer to the given table Predicted Probability Cumulative No Kids 0s Cumula...View the full answer


Horngrens Cost Accounting A Managerial Emphasis
ISBN: 9780135628478
17th Edition
Authors: Srikant M. Datar, Madhav V. Rajan
