

Question: (a) By using the data in Appendix 5, account for the isotopic distribution shown in Fig. 1.1b. (b) The mass spectrum of S 8 shows
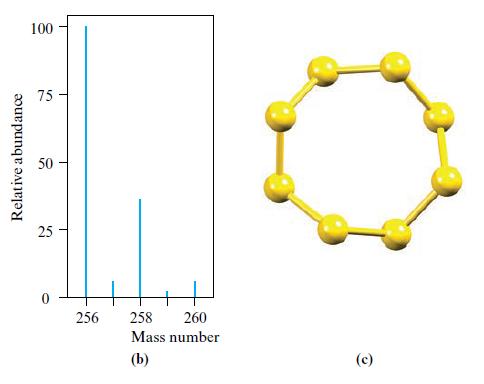
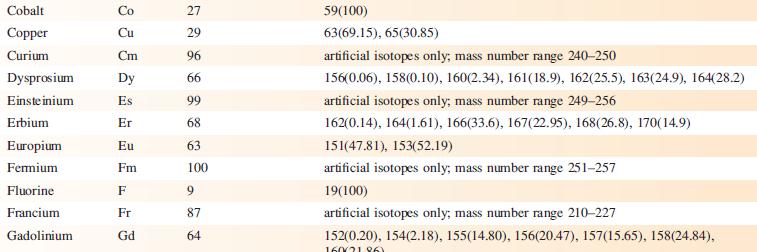
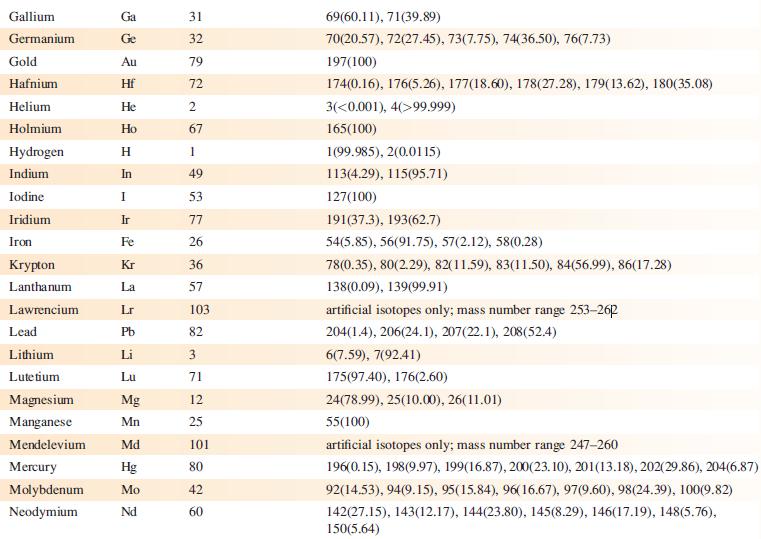
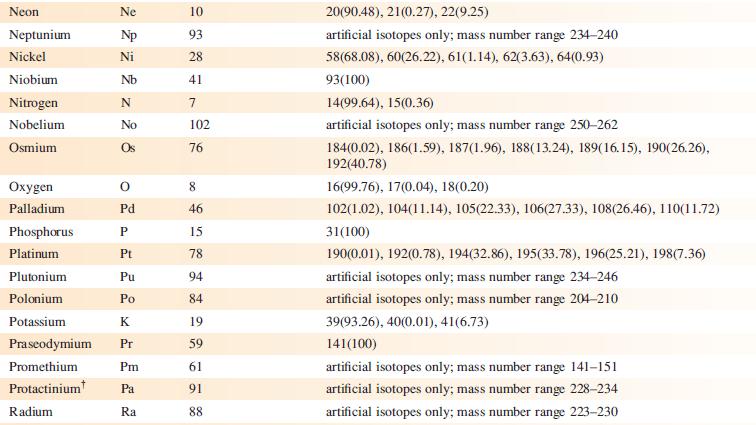
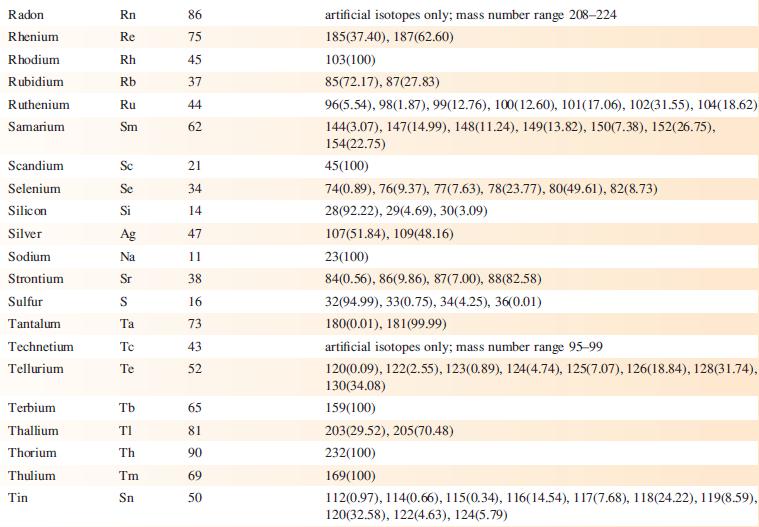
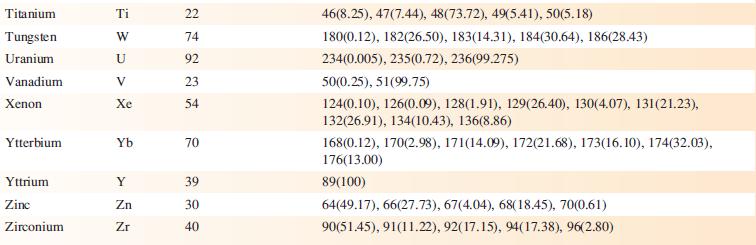
(a) By using the data in Appendix 5, account for the isotopic distribution shown in Fig. 1.1b.
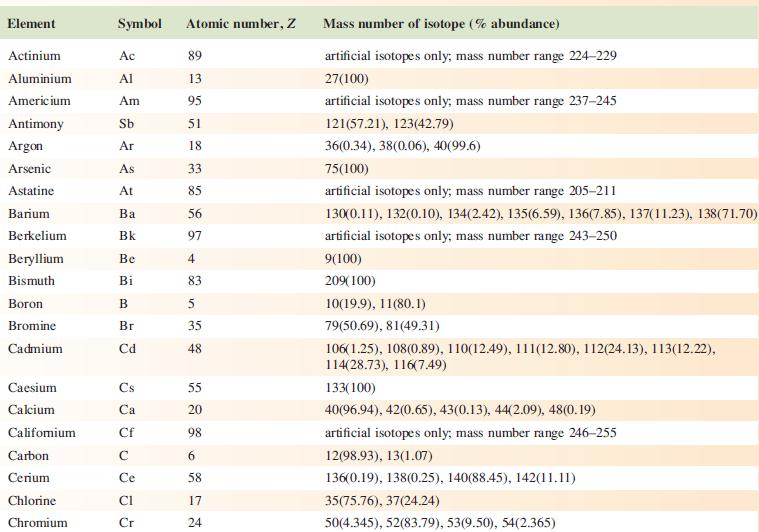
(b) The mass spectrum of S8 shows other peaks at lower values of m/z. By considering the structure of S8 shown in Fig. 1.1c, suggest the origin of these lowermass peaks.
Figure 1.1b and 1.1c.
Data from Appendix 5
Relative abundance 100 75 90 25 0 256 258 260 Mass number (b) (c)
Step by Step Solution
3.43 Rating (150 Votes )
There are 3 Steps involved in it
a By using the data in Appendix 5 account for the isotopic distribution shown in Fig 11b The isotope... View full answer

Get step-by-step solutions from verified subject matter experts