

Determine the g values of the EPR spectrum shown in Fig. 8.57, measured for a frozen sample
Question:
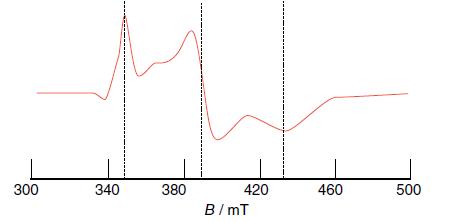
Determine the g values of the EPR spectrum shown in Fig. 8.57, measured for a frozen sample using a microwave frequency of 9.43 GHz.
Figure 8.57
Fantastic news! We've Found the answer you've been seeking!
Step by Step Answer:
The gvalues of the EPR spectrum shown in Fig 857 can be determined using the following equation hv g ...View the full answer

Answered By
KIRAN P
I have M TECH in Chemical Engineering from one of India's best Institute NIT TRICHY and have more than 10 years experience in Chemical industry.Used to teach students during leisure times
0 Reviews
10+ Question Solved
Related Book For 
Inorganic Chemistry
ISBN: 9780198768128
7th Edition
Authors: Mark Weller, Tina Overton, Jonathan Rourke
Question Posted:
