

Figure 1.18 shows the emission spectrum of sodium. Low-pressure sodium street lamps depend upon this bright yellow
Question:
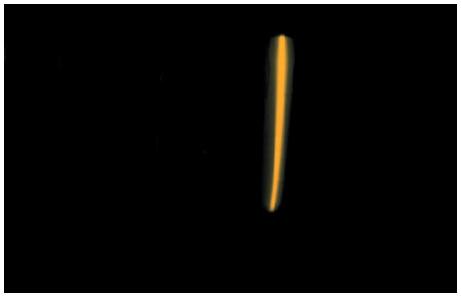
Figure 1.18 shows the emission spectrum of sodium. Low-pressure sodium street lamps depend upon this bright yellow emission from sodium atoms excited by an electrical discharge. Figure 1.18 shows a simple spectrum (see figure caption), but the National Institute of Standards and Technology (NIST) atomic spectra database lists 5888 lines in the emission spectrum of sodium.
(a) Suggest three reasons why no other lines are visible in Fig. 1.18.
(b) The wavelengths of the yellow lines in Fig. 1.18 are close to 589 nm. To what frequency does this correspond?
(c) Give a general explanation of how a series of spectral lines such as those in Fig. 1.18 arises
Figure 1.18
Fantastic news! We've Found the answer you've been seeking!
Step by Step Answer:
a The reasons why no other lines are visible in Fig 118 compared to the 5888 lines listed in the NIST atomic spectra database for sodium could be 1 In...View the full answer

Answered By
Sujata Poudyal
I have been working as a private home tutor since 2015
I teach basic math and science to the students of class 6 to10
I also take tuitions for class 11 and 12 mathematics
I am looking forward to continue my career in teaching thus I am seeking for jobs where I can teach from the comfort of my home.
0 Reviews
10+ Question Solved
Related Book For 

Question Posted:
