

Question: Using data from Appendix 8, construct a graph to show the trend in the third ionization energies of the elements from Li to Kr. Compare
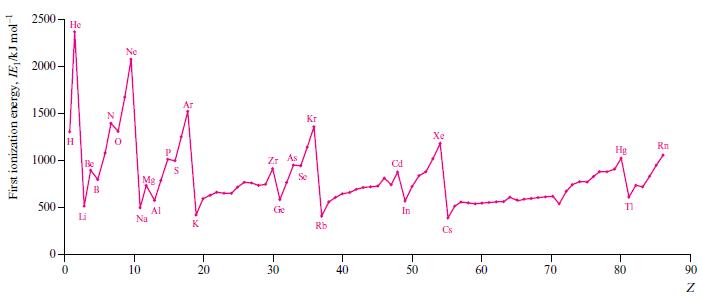
Using data from Appendix 8, construct a graph to show the trend in the third ionization energies of the elements from Li to Kr. Compare the graph with that shown in Fig. 1.16, and rationalize what you observe.
Figure 1.16
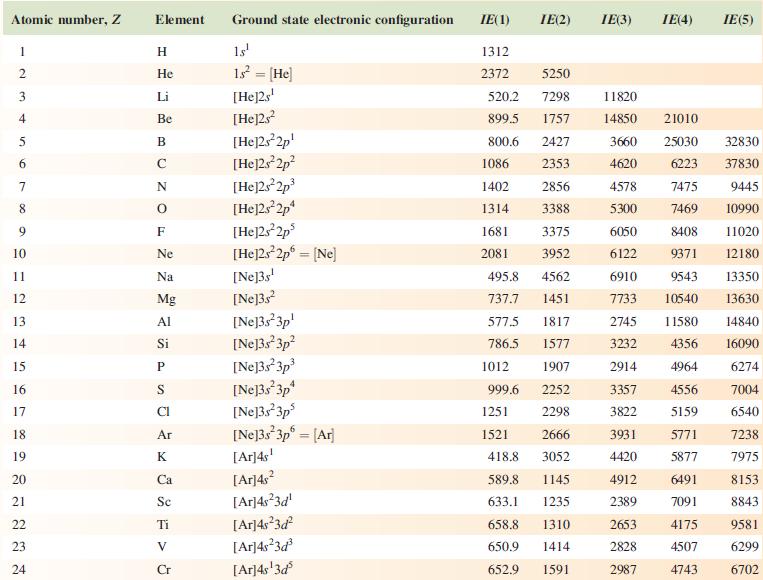
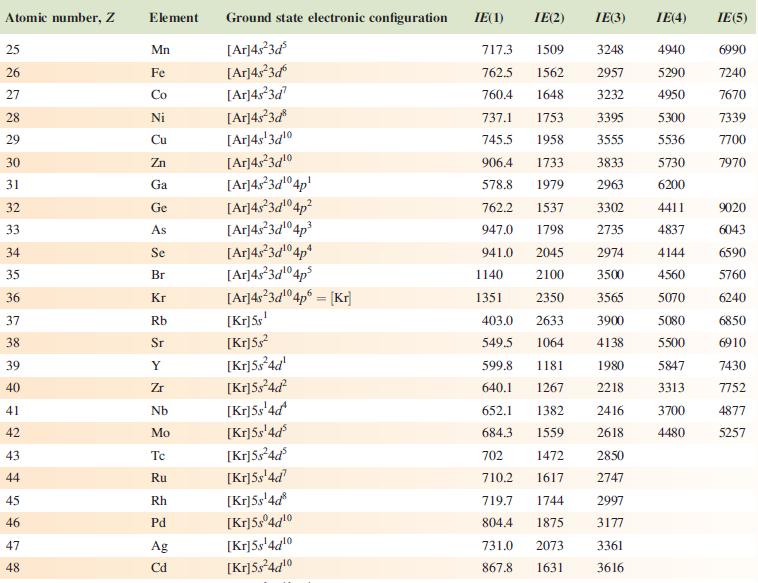
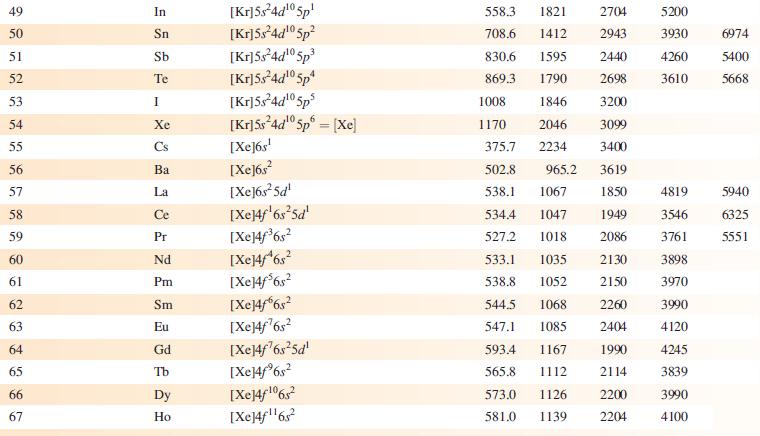
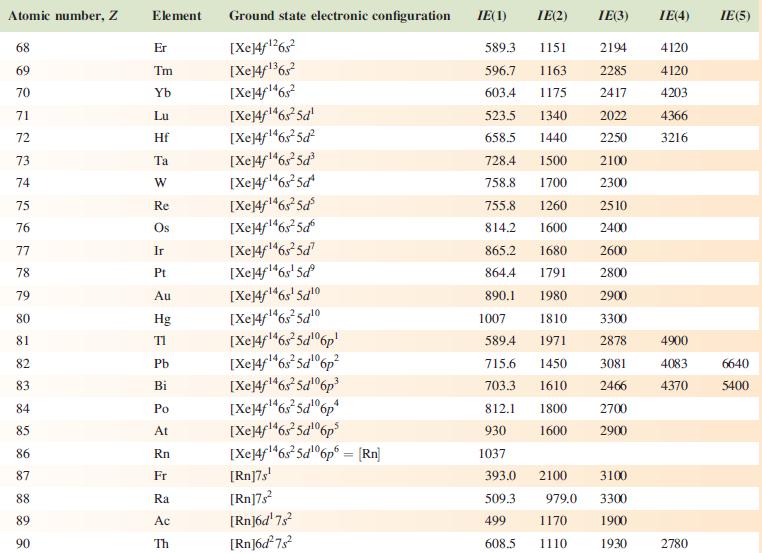
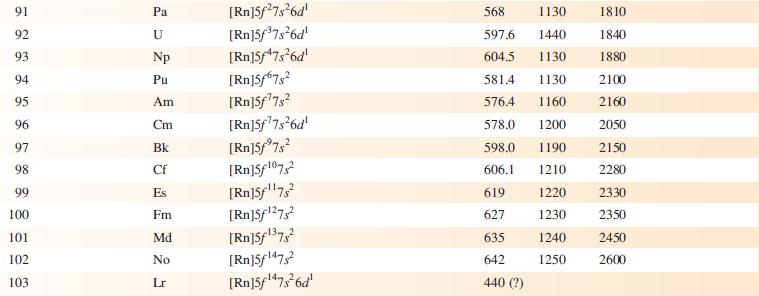
Data from Appendix 8
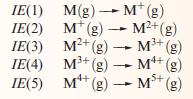
Data are given for the first five ionizations.† IE(n) in kJ mol−1 for the processes:
First ionization energy, IE/kJ mol 2500 2000- 1500- 1000- 500- He H 0 Be Li Ne Mg Na 10 Al 20 Zr As Ge 30 Kr Se Rb 40 Cd In - 50 Xe 60 70 Hg T 80 Rn 90 N
Step by Step Solution
3.47 Rating (163 Votes )
There are 3 Steps involved in it
The amount of energy required to remove an electron from a neutral gaseous atom X in order to form a ... View full answer

Get step-by-step solutions from verified subject matter experts