

Question: The table below contains selected information from recent financial statements of The Home Depot, Inc., and Lowe?s Companies, Inc., two companies in the home improvement
The table below contains selected information from recent financial statements of The Home Depot, Inc., and Lowe?s Companies, Inc., two companies in the home improvement retail industry ($ in millions):
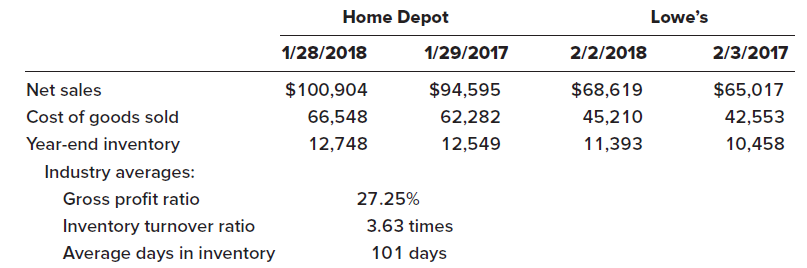
Required:Calculate the gross profit ratio, the inventory turnover ratio, and the average days in inventory for the two companies for their fiscal years ending in 2018. Compare your calculations for the two companies, taking into account the industry averages.
Home Depot Lowe's 1/28/2018 1/29/2017 2/2/2018 2/3/2017 $94,595 $100,904 $65,017 42,553 10,458 $68,619 Net sales Cost of goods sold Year-end inventory Industry averages: Gross profit ratio Inventory turnover ratio 66,548 62,282 45,210 11,393 12,748 12,549 27.25% 3.63 times 101 days Average days in inventory
Step by Step Solution
3.50 Rating (167 Votes )
There are 3 Steps involved in it
The gross profit ratios for the two companies are similar and both e... View full answer

Get step-by-step solutions from verified subject matter experts