

Question: Start with the partial model in the file Ch09 P11 Build a Model.xlsx on the textbooks Web site, which contains Henley Corporations most recent financial
Start with the partial model in the file Ch09 P11 Build a Model.xlsx on the textbook’s Web site, which contains Henley Corporation’s most recent financial statements. Use the following ratios and other selected information for the current and projected years to answer the questions that follow.
a. Forecast the parts of the income statement and balance sheet that are necessary for calculating free cash flow.
b. Calculate free cash flow for each projected year. Also calculate the growth rates in free cash flow each year to ensure that there is constant growth (that is, the same as the constant growth rate in sales) by the end of the forecast period.
c. Calculate the return on invested capital (ROIC = NOPAT/[Total net operating capital]) and the growth rate in free cash flow. What is the ROIC in the last year of the forecast? What is the long-term constant growth rate in free cash flow (gL is the growth rate in FCF in the last forecast period because all ratios are constant)? Do you think that Hensley’s value would increase if it could add growth without reducing its ROIC? (Growth will add value if the ROIC > WACC/[1+WACC]). Do you think that the company will have a value of operations greater than its total net operating capital?(Is ROIC > WACC/[1 + gL]?)
d. Calculate the current value of operations.
e. Calculate the intrinsic price per share of common equity as of December 31, 2021.
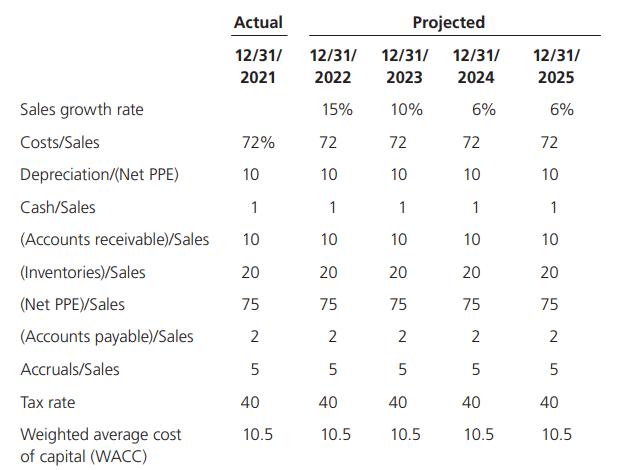
Sales growth rate Costs/Sales Depreciation/(Net PPE) Cash/Sales (Accounts receivable)/Sales (Inventories)/Sales (Net PPE)/Sales (Accounts payable)/Sales Accruals/Sales Tax rate Weighted average cost of capital (WACC) Actual 12/31/ 2021 72% 10 1 10 20 75 2 5 40 10.5 12/31/ 12/31/ 12/31/ 2022 2023 2024 15% 10% 6% 72 10 1 10 20 75 2 5 40 10.5 72 10 1 10 20 75 Projected 2 5 40 10.5 72 10 1 10 20 75 2 5 40 10.5 12/31/ 2025 6% 72 10 1 10 20 75 2 5 40 10.5
Step by Step Solution
3.42 Rating (168 Votes )
There are 3 Steps involved in it
To address your questions we will follow a systematic process using the data provided in the image Our first step will be forecasting the parts of the income statement and balance sheet required for c... View full answer

Get step-by-step solutions from verified subject matter experts