Draw a graph like the one in Figure 13.5, which shows the effects of transborder pollution. There
Question:
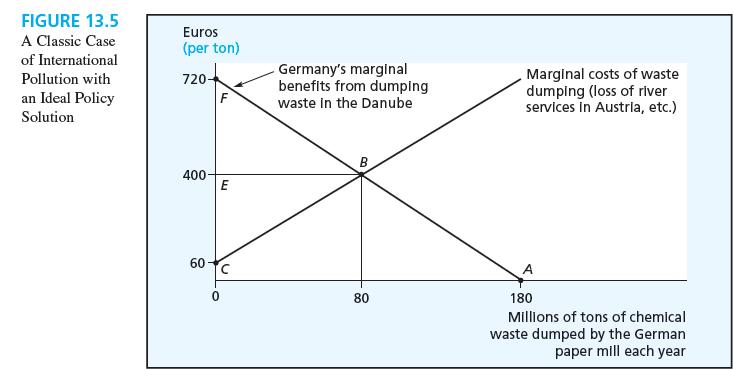
Draw a graph like the one in Figure 13.5, which shows the effects of transborder pollution.
There is no governmental agreement on how to control the pollution, so the German firm is dumping 180 tons of waste into the river. There is free trade in paper, and Austria imports paper.
Now Austria imposes a 30 percent tariff on paper imports, which reduces Austrian imports of paper from Germany by 20 percent. As a result of imposing the tariff, Austria suffers standard deadweight losses from the tariff equal to €5 billion. Also as a result of the tariff, Germany produces less paper, and the German firm shown in the graph reduces its dumping of waste by 10 percent.
a. Using your graph, show the effect on Austria of this change in the waste dumping.
Calculate the euro value of the effect of the change in waste dumping on Austria’s well-being.
b. Overall, including both the standard effect of the tariff (not shown in the graph) and the effect of the change in waste dumping, is Austria better off or worse off (than it was before it imposed the tariff)?
Data From Figure 13.5
Step by Step Answer:
a The graph shows the marginal benefit to German MBG from dumping waste into the Danube and the marg...View the full answer