

Question: 3. Vineyards Here are the scatterplot and regression analysis for Case Prices of 36 wines from vineyards in the Finger Lakes region of New York
3. Vineyards Here are the scatterplot and regression analysis for Case Prices of 36 wines from vineyards in the Finger Lakes region of New York State and the Ages of the vineyards..
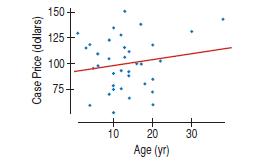
Dependent variable is Case Price R-squared = 2.7%
Variable Coefficient Constant 92.7650 Age 0.567284
a) Does it appear that vineyards in business longer get higher prices for their wines? Explain.
b) What does this analysis tell us about vineyards in the rest of the world?
c) Write the regression equation.
d) Explain why that equation is essentially useless.
Case Price (dollars) 150+ 125- 100 75 + 10 20 30 Age (yr)
Step by Step Solution
There are 3 Steps involved in it
1 Expert Approved Answer
Step: 1 Unlock

Question Has Been Solved by an Expert!
Get step-by-step solutions from verified subject matter experts
Step: 2 Unlock
Step: 3 Unlock