

Question: As a class project, students in a large Statistics class collected publicly available information on recent home sales in their hometowns. There are 894 properties.
As a class project, students in a large Statistics class collected publicly available information on recent home sales in their hometowns. There are 894 properties.
These are not a random sample, but they may be representative of home sales during a short period of time, nationwide. (Data in Real estate project)
Variables available include the price paid, the size of the living area (sq ft), the number of bedrooms, the number of bathrooms, the year of construction, the lot size (acres), and a coding of the location as urban, suburban, or rural made by the student who collected the data.
Here’s a regression to model the sale price from the living area (sq ft) and the number of bedrooms.
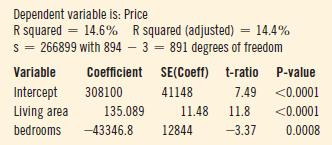
Question: How should we interpret the regression output?
Dependent variable is: Price R squared =14.6% R squared (adjusted) = 14.4% s=266899 with 894-3891 degrees of freedom Variable Coefficient SE(Coeff) t-ratio P-value Intercept 308100 41148 7.49
Step by Step Solution
There are 3 Steps involved in it

Get step-by-step solutions from verified subject matter experts