

Question: Cereals, redux We also have data on the protein content of the cereals in Exercise 19 by their shelf number. Here are the boxplot and
Cereals, redux We also have data on the protein content of the cereals in Exercise 19 by their shelf number. Here are the boxplot and ANOVA table:
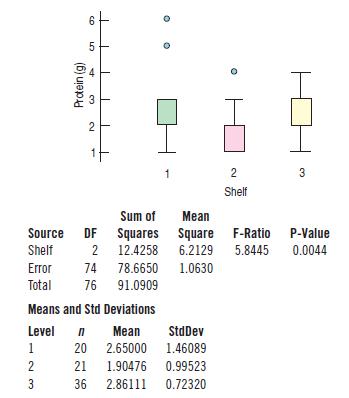
a) What are the null and alternative hypotheses?
b) What does the ANOVA table say about the null hypothesis? (Be sure to report this in terms of protein content and shelves.)
c) Can we conclude that cereals on shelf 2 have a lower mean protein content than cereals on shelf 3? Can we conclude that cereals on shelf 2 have a lower mean protein content than cereals on shelf 1? What can we conclude?
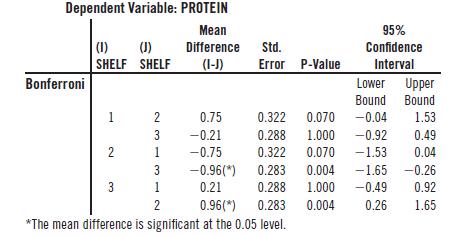
d) To check for significant differences between the shelf means we can use a Bonferroni test, whose results are shown below. For each pair of shelves, the difference is shown along with its standard error and significance level. What does it say about the questions in part c?
Co Protein (g) 4 3 5 2 1 2 3 Shelf Source DF Sum of Squares Mean Square F-Ratio P-Value Shelf 2 12.4258 6.2129 5.8445 0.0044 Error 74 78.6650 78.6650 1.0630 Total 76 91.0909 Means and Std Deviations Level n Mean StdDev 1 2 23 3 20 2.65000 1.46089 21 1.90476 0.99523 36 2.86111 0.72320
Step by Step Solution
There are 3 Steps involved in it

Get step-by-step solutions from verified subject matter experts