

Question: Character recognition, again The automatic character recognition device discussed in Exercise 4 successfully reads about 85% of handwritten credit card applications. In Exercise 4, you
Character recognition, again The automatic character recognition device discussed in Exercise 4 successfully reads about 85% of handwritten credit card applications.
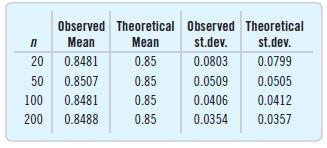
In Exercise 4, you looked at the histograms showing distributions of sample proportions from 1000 simulated samples of size 20, 50, 75, and 100. The sample statistics and theoretical values for each simulation are as follows
a) Looking at the histograms in Exercise 4, at what sample size would you be comfortable using the Normal model as an approximation for the sampling distribution?
b) What does the Success/Failure Condition say about the choice you made in part a?
Observed Theoretical Observed Theoretical n Mean Mean st.dev. st.dev. 20 0.8481 0.85 0.0803 0.0799 50 0.8507 0.85 0.0509 0.0505 100 0.8481 0.85 0.0406 0.0412 200 0.8488 0.85 0.0354 0.0357
Step by Step Solution
There are 3 Steps involved in it

Get step-by-step solutions from verified subject matter experts