

Question: Coasters 2015 sampled Return to the data on roller coasters seen in Exercise 23. Here is the distribution of the lengths of the rides of
Coasters 2015 sampled Return to the data on roller coasters seen in Exercise 23. Here is the distribution of the lengths of the rides of 241 coasters.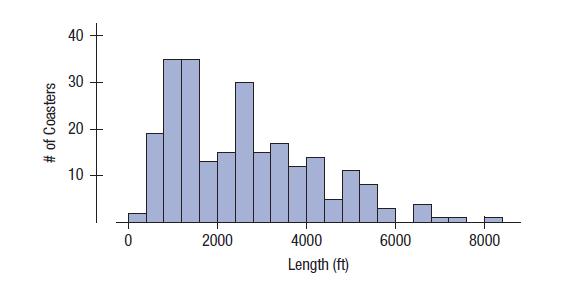
We drew samples of 60 coasters from the full set of 241. We then repeated this 1000 times. For each sample, we found the mean and median. Here are histograms of the 1000 means and 1000 medians: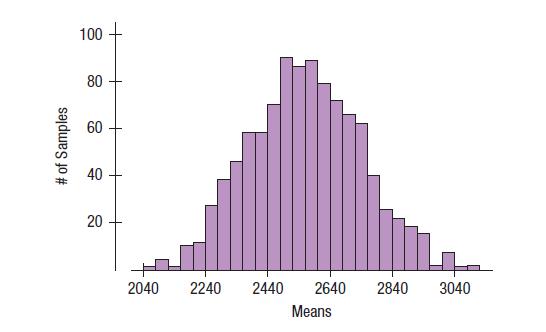
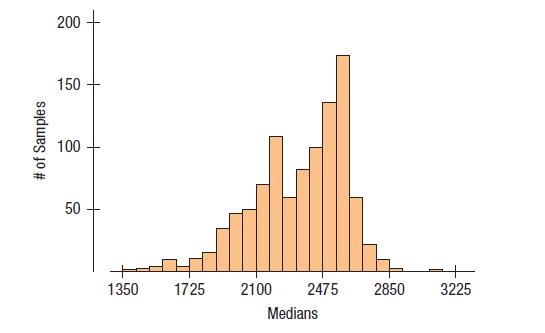
For which of these distributions would you use the 68–95–99.7 Rule? Explain.
40 40 30 # of Coasters 20 20 10 2000 4000 6000 8000 Length (ft)
Step by Step Solution
There are 3 Steps involved in it
1 Expert Approved Answer
Step: 1 Unlock

Question Has Been Solved by an Expert!
Get step-by-step solutions from verified subject matter experts
Step: 2 Unlock
Step: 3 Unlock