

Question: Consider the relationship between the life expectancy (in years) and the illiteracy rate (per hundred people) in the 50 U.S. states plus Washington, DC. A
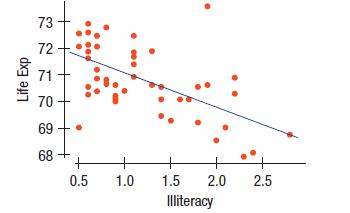
Consider the relationship between the life expectancy (in years) and the illiteracy rate (per hundred people) in the 50 U.S. states plus Washington, DC. A linear model is run and the output is presented here:
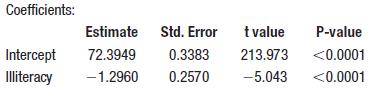
Residual standard deviation: 1.097 on 48 degrees of freedom Multiple R-squared: 0.3463,
a) Colorado has an illiteracy rate of 0.70. What is its predicted life expectancy?
b) Based on the analysis, which of the following can you conclude about this relationship?
i. Reducing illiteracy will increase life expectancy.
ii. Reducing illiteracy will reduce life expectancy.
iii. If you move to a state that spends less money on teachers, your life expectancy will go down, on average, due to lurking variables.
iv. Higher levels of illiteracy are associated with generally lower life expectancies.
v. States with lower life expectancies generally have lower illiteracy rates.
vi. None of the above
c) What is the correlation between life expectancy and illiteracy?
d) Tennessee’s illiteracy rate is about 1 SD above the mean for all states. What do you predict its life expectancy to be?
i. About 1.296 SDs below the mean life expectancy.
ii. About 1 SD below the mean life expectancy.
iii. About 1 SD above the mean life expectancy.
iv. About 0.59 SD below the mean life expectancy.
v. None of the above
e) High school graduation rate has a correlation of 0.60 with life expectancy. A simple regression of life expectancy on igh school graduation rate shows a positive slope with a very low P-value. If you add high school graduation rate as a predictor to the regression of life expectancy on illiteracy, and fit a multiple regression on high school graduation and
Illiteracy, which of the following is true?
i. The R2 of this model is at least as high as the R2 of either single predictor model.
ii. The slope of the high school graduation rate is positive.
iii. The slope of the high school graduation rate is negative.
iv. The slope of the high school graduation rate is statistically significant.
i. None of the above
Coefficients: Estimate Std. Error t value 0.3383 213.973 0.2570 -5.043 Intercept 72.3949 Illiteracy -1.2960 P-value
Step by Step Solution
3.31 Rating (160 Votes )
There are 3 Steps involved in it
a The scatterplot looks straight enough ... View full answer

Get step-by-step solutions from verified subject matter experts