

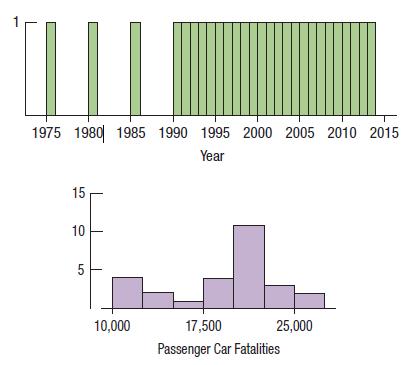
Question: Here are the same histograms as in Exercise 7. However, the two groups of fatalities have been highlighted, and the corresponding bars in the Year
Here are the same histograms as in Exercise 7. However, the two groups of fatalities have been highlighted, and the corresponding bars in the Year histogram are also highlighted.
a) How many years are included in the highlighted bar in the Passenger car fatalities histogram?
b) Which years are included?
c) What do these histograms, taken together, say about passenger car fatalities?
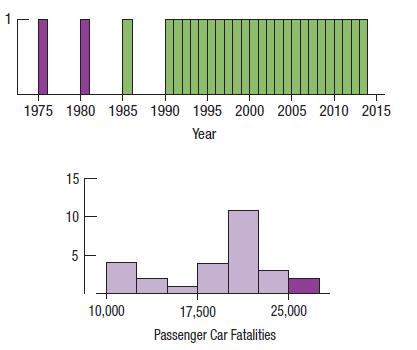
Data From Exercise 7
Here are two histograms showing the annual number of traffic fatalities in passenger cars. (NHTSA) One plots the years, and the other plots the fatalities.
IL 1975 1980 1985 1990 1995 2000 2005 2010 2015 Year 15 10 5 10,000 25,000 17,500 Passenger Car Fatalities
Step by Step Solution
3.54 Rating (161 Votes )
There are 3 Steps involved in it
a The highlighted bar in the Passenger car fatalities ... View full answer

Get step-by-step solutions from verified subject matter experts