

Question: In Exercise 69, we saw the relationship between CO 2 measured at Mauna Loa and average global temperature anomaly from 1959 to 2016. Here is
In Exercise 69, we saw the relationship between CO2 measured at Mauna Loa and average global temperature anomaly from 1959 to 2016. Here is a plot of average global temperatures plotted against the yearly final value of the Dow Jones Industrial Average for the same time period.
Data From Exercise 69
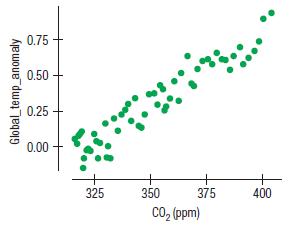
The earth’s climate is getting warmer. The most common theory attributes the increase to an increase in atmospheric levels of carbon dioxide (CO2), a greenhouse gas. Here is a scatterplot showing the mean annual temperature anomaly (the difference between the mean global temperature and a base period of 1981 to 2010 in °C) and the CO2 concentration in the atmosphere in parts per million (ppm) at the top of Mauna Loa in Hawaii for the years 1959 to 2016.
A regression produces the following output table (in part):
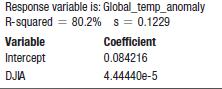
a) What is the correlation between the DJIA and Temperature?
b) Explain the meaning of R-squared in this context.
c) Give the regression equation.
d) What is the meaning of the slope in this equation?
e) What is the meaning of the intercept of this equation?
f) Here is a scatterplot of the residuals vs. predicted values. Does this plot show evidence of the violation of any assumptions behind the regression? If so, which ones?
g) Suppose the Dow hits 25,000 in 2020. What mean Temperature does the regression predict for that level?
h) Does the answer in part g mean that when the Dow hits 25,000, the Temperature will reach the predicted level? Explain briefly.
Global_temp_anomaly 0.75 0.50 0.25 0.00- 325 + 350 + 375 CO (ppm) 400
Step by Step Solution
3.32 Rating (161 Votes )
There are 3 Steps involved in it
a The correlation between Dow Jones Industrial Average and mean global temperature anomaly is b 802 ... View full answer

Get step-by-step solutions from verified subject matter experts