

Question: In Exercise 8 you were asked to compare the responses of college presidents and all U.S. adults to the question about the value of a
In Exercise 8 you were asked to compare the responses of college presidents and all U.S. adults to the question about the value of a college education. To examine that question further, we randomly scrambled the responses and created 15 new mosaic plots of these scrambled distributions.
a) Can you spot the original data among the 15 new plots?
b) How does this support your answer to Exercise 8c?
Data From Exercise 8
Here is a mosaic plot of the data from Exercise 1 on whether college provides value from a survey of U.S. adults and college presidents:
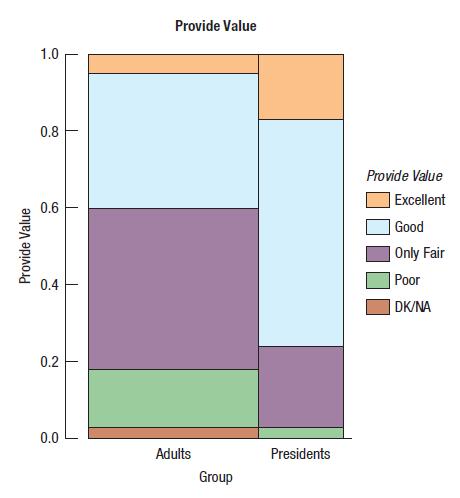
Provide Value 1.0 0.8 0.6 0.4 0.2 Provide Value Adults Group Presidents Provide Value Excellent Good Only Fair Poor DK/NA
Step by Step Solution
3.44 Rating (163 Votes )
There are 3 Steps involved in it
a Yes it is possible to spot the original data among the 15 new plots The original data can be ... View full answer

Get step-by-step solutions from verified subject matter experts