

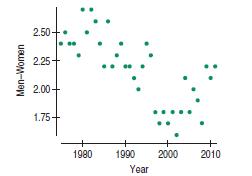
Question: Marriage age 2011 The scatterplot suggests a decrease in the difference in ages at first marriage for men and women since 1975. We want to
Marriage age 2011 The scatterplot suggests a decrease in the difference in ages at first marriage for men and women since 1975. We want to examine the regression to see if this decrease is significant.
a) Write appropriate hypotheses.
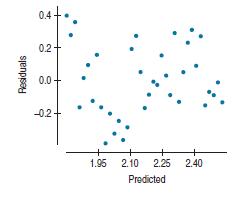
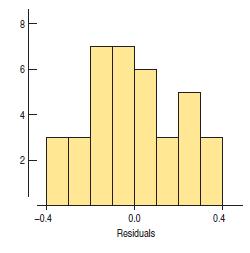
b) Here is the residuals plot and a histogram of the residuals.
Do you think the conditions for inference are satisfied? Explain.
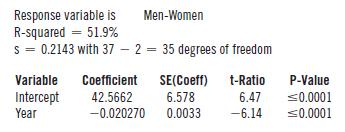
c) Test the hypothesis and state your conclusion about the trend in age at first marriage.
2.50- 2.25- 2.00+ Men-Women 1.75- 1980 1990 2000 2010 Year
Step by Step Solution
There are 3 Steps involved in it
1 Expert Approved Answer
Step: 1 Unlock

Question Has Been Solved by an Expert!
Get step-by-step solutions from verified subject matter experts
Step: 2 Unlock
Step: 3 Unlock