

Question: The following table summarizes 1529 films from 2014 and 2015 that have been classified into a genre and have a MPAA rating. a) What percent
The following table summarizes 1529 films from 2014 and 2015 that have been classified into a genre and have a MPAA rating.
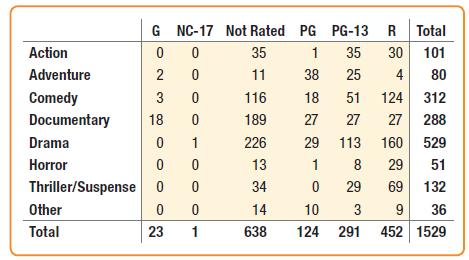
a) What percent of these films were rated R?
b) What percent of these films were R-rated comedies?
c) What percent of R-rated films were comedies?
d) What percent of comedies were rated R?
Action Adventure Comedy Documentary Drama Horror Thriller/Suspense Other Total G NC-17 Not Rated PG PG-13 R Total 0 35 1 35 30 101 0 11 38 25 4 80 0 116 18 51 124 312 18 0 189 27 27 27 288 0 1 226 29 113 160 529 0 0 13 1 8 29 51 0 0 34 0 29 69 132 0 14 10 3 9 36 1 638 124 291 452 1529 0 2 3 0 23
Step by Step Solution
3.37 Rating (163 Votes )
There are 3 Steps involved in it
a 4521529 296 of the films were rat... View full answer

Get step-by-step solutions from verified subject matter experts