

Question: The Pew Research survey cited in Exercise 27 also asked what employment sector the respondents worked in and whether their job gave them a sense
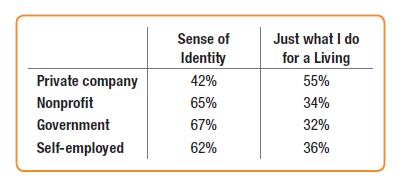
The Pew Research survey cited in Exercise 27 also asked what employment sector the respondents worked in and whether their job gave them a sense of identity or whether it was “just what they do for a living.” This table summarizes their responses:
a) Is this a table of row percents, column percents, or table percents?
How can you tell?
b) Which of the following can you tell from this table? Give the value if you can find it.
i. The percent of respondents who both consider their job just what they do for a living and are self-employed
ii. The percent of Nonprofit employees who get a sense of identity from their job
iii. The percent of those who find their work Just what they do for a living who are Private company employees
iv. The percent of all respondents who get a sense of identity from their job
Private company Nonprofit Government Self-employed Sense of Identity 42% 65% 67% 62% Just what I do for a Living 55% 34% 32% 36%
Step by Step Solution
3.43 Rating (175 Votes )
There are 3 Steps involved in it
a These are row percents The rows add up to nearly 100 while the column... View full answer

Get step-by-step solutions from verified subject matter experts