

Question: We have seen data on ballpark attendance in Chapters 6, 7, and 9. Now we find that National League teams drew in, on average, nearly
We have seen data on ballpark attendance in Chapters 6, 7, and 9. Now we find that National League teams drew in, on average, nearly 60,000 more fans per season than American League teams. That translates to over $1,000,000 a year. To see whether that difference is statistically significant:
a) Make a boxplot of the Home Attendance by League.
b) Look at this histogram of 1000 differences in means of Home Attendance by League obtained by shuffling the League label among the 30 teams. What does it say about whether 60,000 is a statistically significant difference?
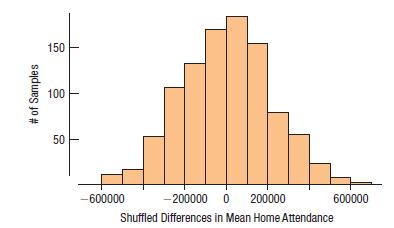
# of Samples 150 100 50 -200000 0 200000 Shuffled Differences in Mean Home Attendance -600000 600000
Step by Step Solution
3.38 Rating (164 Votes )
There are 3 Steps involved in it
a Boxplots of Home Attendance by League are at the right b A difference of 600... View full answer

Get step-by-step solutions from verified subject matter experts