

Question: Draw a box-and-whisker plot for each data set. Minutes to Run 5km 22.1 20.8 36.2 31.5 22.1 34.6 23.2 36.8 27.1
Draw a box-and-whisker plot for each data set.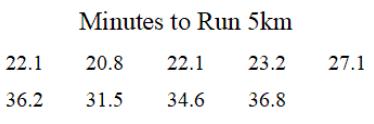
Minutes to Run 5km 22.1 20.8 36.2 31.5 22.1 34.6 23.2 36.8 27.1
Step by Step Solution
★★★★★
3.39 Rating (155 Votes )
There are 3 Steps involved in it
1 Expert Approved Answer
Step: 1 Unlock

20 22... View full answer
Question Has Been Solved by an Expert!
Get step-by-step solutions from verified subject matter experts
Step: 2 Unlock
Step: 3 Unlock