

Question: Draw contour diagrams to show the state of execution right after the execution of the statement line1=new LineSI (pt1, pt2); in Fig. 5.15 in Sect.
Draw contour diagrams to show the state of execution right after the execution of the statement line1=new LineSI (pt1, pt2); in Fig. 5.15 in Sect. 5.6.1.
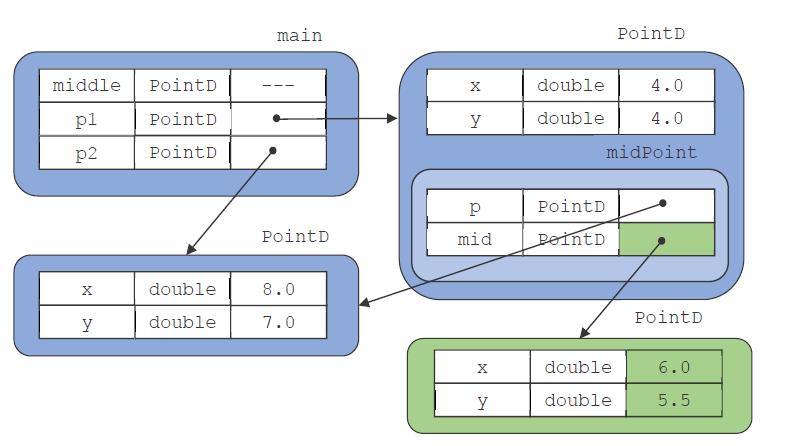
middle PointD pl PointD p2 PointD X y double double main PointD 8.0 7.0 X y mid Y double double PointD PointD PointD midPoint double double 4.0 4.0 PointD 6.0 5.5
Step by Step Solution
★★★★★
3.40 Rating (163 Votes )
There are 3 Steps involved in it
1 Expert Approved Answer
Step: 1 Unlock

The image you provided appears to be a diagram from a computer science or programming textbook showi... View full answer
Question Has Been Solved by an Expert!
Get step-by-step solutions from verified subject matter experts
Step: 2 Unlock
Step: 3 Unlock