

To explore the Fourier series representation of signals, complete the following. (a) Approximate a square wave by
Question:
To explore the Fourier series representation of signals, complete the following.
(a) Approximate a square wave by plotting the following function in MATLAB \({ }^{\circledR}\). Begin a new \(m\)-file by selecting File/New/M-File.
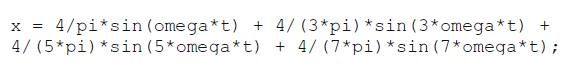
\[x=\frac{4}{\pi} \sin (\omega t)+\frac{4}{3 \pi} \sin (3 \omega t)+\frac{4}{5 \pi} \sin (5 \omega t)+\frac{4}{7 \pi} \sin (7 \omega t)\]
Use \(\omega=2 \pi \mathrm{rad} / \mathrm{s}\) and plot your results from \(t=0\) to \(5 \mathrm{~s}\) in steps of \(0.001 \mathrm{~s}\). You can define your time vector using the following statement:
\(t=0: 0.001: 5 ;\)
Also, \(\pi\) can be defined in MATLAB \({ }^{\circledR}\) using pi. Finally, the argument for sine (or any harmonic function) must be in rad/s in MATLAB \({ }^{\circledR}\) (not degrees). For example, you can define the displacement using the following statement:
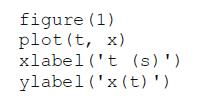
To plot the result, you can use the following statements:
(b) What is the period (in seconds) of the waveform?
(c) What is the frequency in \(\mathrm{Hz}\) ?
(d) Replot the function using 50 terms (following the pattern of odd multiples of \(\omega\) with the \(\frac{4}{n \pi}\) coefficients where \(\left.n=1,3,5, \ldots\right)\). What is the effect of including additional terms?
Step by Step Answer:

This question has not been answered yet.
You can Ask your question!


Mechanical Vibrations Modeling And Measurement
ISBN: 119669
1st Edition
Authors: Tony L. Schmitz , K. Scott Smith
