

Question: Americans become more knowledgeable about computer hardware and software, as prices drop and installation becomes easier, home networking of PCs is expected to penetrate 27
a. What graphical methods could you use to describe the data?
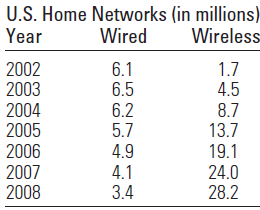
b. Before you draw a graph, look at the predicted number of wired and wireless households in the table. What trends do you expect to see in the graphs?
c. Use a line chart to describe the predicted number of wired households for the years 2002 to 2008.
d. Use a bar chart to describe the predicted number of wireless households for the years 2002 to 2008.
U.S. Home Networks (in millions) Wired Wireless Year 1.7 4.5 8.7 13.7 19.1 24.0 28.2 2002 2003 2004 2005 2006 6.1 6.5 6.2 5.7 4.9 4.1 3.4 2007 2008
Step by Step Solution
3.46 Rating (169 Votes )
There are 3 Steps involved in it
a The quantitative variable number of networks is measured over time for two different types of ... View full answer

Get step-by-step solutions from verified subject matter experts