

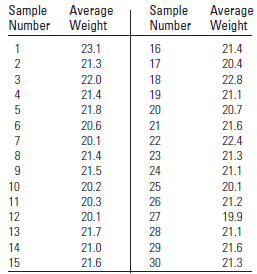
During long production runs of canned tomatoes, the average weights (in ounces) of samples of five cans
Question:
a. Compute the upper and lower control limits and the centerline for the xÌ… chart.
b. Plot the sample data on the xÌ… chart and determine whether the performance of the machine is in control.
Fantastic news! We've Found the answer you've been seeking!
Step by Step Answer:
a If the process is in control 120 Calculate With n 5 t...View the full answer

Answered By
PALASH JHANWAR
I am a Chartered Accountant with AIR 45 in CA - IPCC. I am a Merit Holder ( B.Com ). The following is my educational details.
PLEASE ACCESS MY RESUME FROM THE FOLLOWING LINK: https://drive.google.com/file/d/1hYR1uch-ff6MRC_cDB07K6VqY9kQ3SFL/view?usp=sharing
3+ Reviews
10+ Question Solved
Related Book For 
Introduction To Probability And Statistics
ISBN: 9780495389538
13th Edition
Authors: William Mendenhall, Robert J. Beaver, Barbara M. Beaver
Question Posted:
