

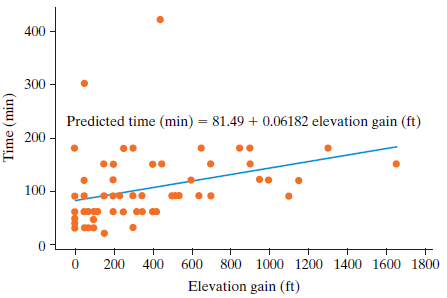
Question: Reconsider the previous exercise. The following scatterplot displays hiking time vs. elevation gain, with the least squares line superimposed: 400 300 - Predicted time (min)
a. Report the value of the slope coefficient for predicting time from elevation gain.
b. Write a sentence interpreting the value of the slope coefficient for predicting time from elevation gain.
c. Use the line to predict how long a hike with an 800-foot elevation gain will take.
d. Would you feel more comfortable using the line predict the time for a hike with an 800-foot elevation gain or a hike with a 2,800-foot elevation gain? Explain your choice.
e. The value of the correlation coefficient between time and distance is 0.344, and the value of r2 = 0.119. Complete this sentence to interpret what this value means:
11.9% of ______________ is explained by __________.
400 300 - Predicted time (min) = 81.49 + 0.06182 elevation gain (ft) %3D 200 - 100 17," 200 400 600 800 1000 1200 1400 1600 1800 Elevation gain (ft) Time (min)
Step by Step Solution
3.36 Rating (174 Votes )
There are 3 Steps involved in it
a 006182 b For each additional foot in elevation the predicted hi... View full answer

Get step-by-step solutions from verified subject matter experts