

Question: Reconsider the previous exercise. a. Based on the dotplot, determine the sample proportion of married couples for whom the wife is older than the husband.
a. Based on the dotplot, determine the sample proportion of married couples for whom the wife is older than the husband.
b. Is it valid to use a theory-based procedure to estimate the population proportion of married couples for which the wife is older than the husband? Justify your answer.
c. Determine and interpret a 90% confidence interval for the population proportion of married couples for whom the wife is older than the husband.
d. Based on this confidence interval, do the sample data provide strong evidence that the wife is older than the husband in less than 50% of all marriages? Explain how your answer follows from the confidence interval.
Data from previous exercise
A student went to the local county courthouse (in Cumberland County, Pennsylvania, in June and July of 1993) to gather data on ages of soon-to-be husbands and wives who had recently applied for marriage licenses. He gathered age data on a sample of 100 couples and calculated the difference in age (husband€“wife) for each couple. The results, which can be found in the file Marriage Ages on the textbook website, are displayed in the 3.CE.23 dotplot:
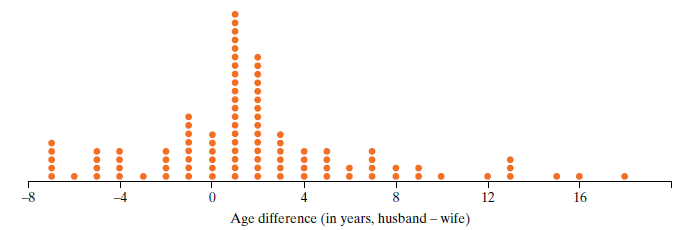
12 16 -4 8 -8 Age difference (in years, husband wife)
Step by Step Solution
3.44 Rating (157 Votes )
There are 3 Steps involved in it
a 27 out 100 027 b Yes because there are at least 10 couples where the wife is o... View full answer

Get step-by-step solutions from verified subject matter experts