

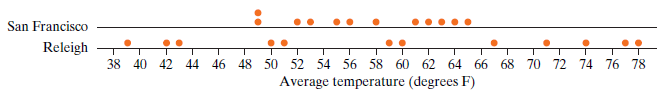
The following dotplot shows the average monthly temperatures ( o F) for San Francisco, CA, and Raleigh,
Question:
a. What are the observational units here?
b. Identify the response variable and whether it is categorical or quantitative.
c. Would the mean be a reasonable measure of center for these data? Why or why not?
d. The yearly mean temperature for Raleigh is 59.25oF and the yearly mean temperature for San Francisco is 57.25oF.
Since these values are rather close, is it fair to say the cities are similar with respect to average monthly temperatures?
e. Will the standard deviation for Raleigh be larger or smaller than the standard deviation for San Francisco? How are you deciding?
Fantastic news! We've Found the answer you've been seeking!
Step by Step Answer:
a Average monthly temperatures b Avera...View the full answer

Answered By
Branice Buyengo Ajevi
I have been teaching for the last 5 years which has strengthened my interaction with students of different level.
1+ Reviews
10+ Question Solved
Related Book For 

Introduction To Statistical Investigations
ISBN: 9781118172148
1st Edition
Authors: Beth L.Chance, George W.Cobb, Allan J.Rossman Nathan Tintle, Todd Swanson Soma Roy
Question Posted:
