

The table below shows the prices of 8 single handset cordless phones along with their overall score
Question:
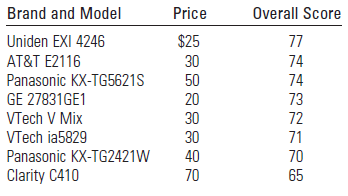
a. Calculate the correlation coefficient r between price and overall score. How would you describe the relationship between price and overall score?
b. Use the applet called Correlation and the Scatterplot to plot the eight data points. What is the correlation coefficient shown on the applet? Compare with the value you calculated in part a.
c. Describe the pattern that you see in the scatterplot. What unexpected relationship do you see in the data?
Fantastic news! We've Found the answer you've been seeking!
Step by Step Answer:
a Calculate Then the covariance is The sample standard deviations are ...View the full answer

Answered By
Muhammad Ahtsham Shabbir
I am a professional freelance writer with more than 7 years’ experience in academic writing. I have a Bachelor`s Degree in Commerce and Master's Degree in Computer Science. I can provide my services in various subjects.
I have professional excellent skills in Microsoft ® Office packages such as Microsoft ® Word, Microsoft ® Excel, and Microsoft ® PowerPoint. Moreover, I have excellent research skills and outstanding analytical and critical thinking skills; a combination that I apply in every paper I handle.
I am conversant with the various citation styles, among them; APA, MLA, Chicago, Havard, and AMA. I also strive to deliver the best to my clients and in a timely manner.My work is always 100% original. I honestly understand the concern of plagiarism and its consequences. As such, I ensure that I check the assignment for any plagiarism before submission.
392+ Reviews
587+ Question Solved
Related Book For 

Introduction To Probability And Statistics
ISBN: 9780495389538
13th Edition
Authors: William Mendenhall, Robert J. Beaver, Barbara M. Beaver
Question Posted:
