

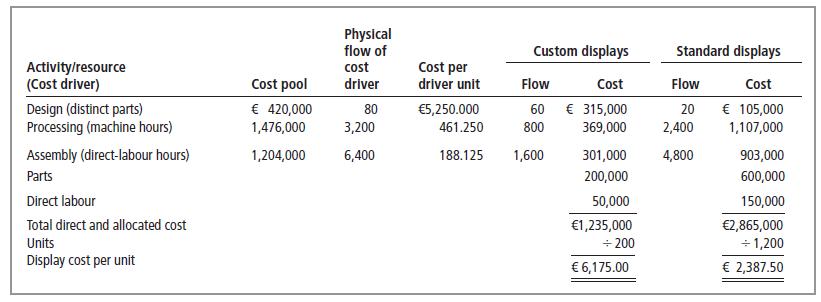
Consider our example of the manufacturers display facility. Exhibits 12.8 and 12.9 on p. 536 and 537
Question:
Consider our example of the manufacturer’s display facility. Exhibits 12.8 and 12.9 on p. 536 and 537 show how the company used the ABC approach to determine the cost of goods sold for custom and standard displays. Suppose that management wants to know the profitability of its major customers. Assume that two major customers are Southwest Hardware Stores (SHS) and Southeast Appliance Stores (SAS). SHS orders a mix of custom and standard displays. It also has unique service requirements, orders relatively small order sizes and requires substantial pre- and post-sales support from customer service and corporate staff. In contrast, SAS orders only a few custom displays, has larger order quantities and does not require much customer service or corporate staff support. Accountants have performed an analysis of customer-related activities and concluded that two activities capture the main differences in cost to serve among the customers – sales activity and customer and corporate support. Both customers use these activities to some extent, and it is not economically feasible to directly trace these costs to customers.
Therefore, the company allocates these costs to customers. The cost-allocation bases chosen are number of orders for the sales activity cost pool and service and staff labour hours for the customer and corporate support cost pool.
To determine the profitability of the two customers, the company has collected the following data:
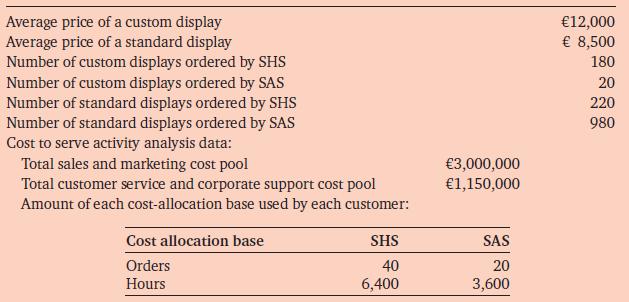
Exhibit 12.8
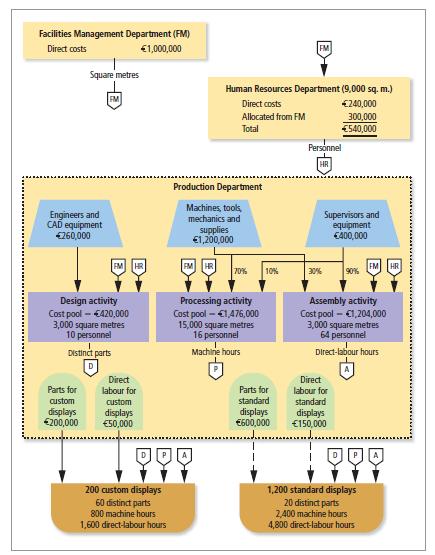
Exhibit 12.9
1. Calculate the gross margin percentage and cost-to-serve percentage for Southwest Hardware Stores and Southeast Appliance Stores.
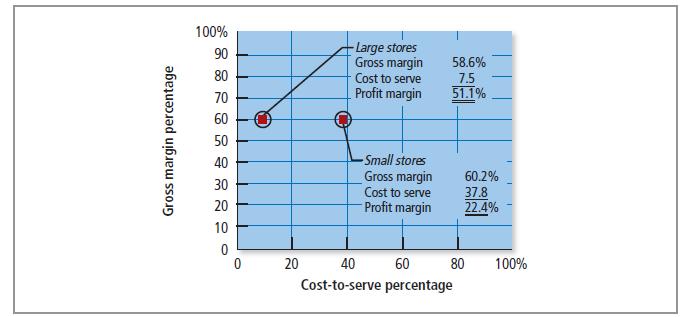
2. Construct a graph similar to Exhibit 12.16 that depicts customer profitability for Southwest Hardware Stores and Southeast Appliance Stores.
Exhibit 12.16
3. Suggest a strategy for profit improvement for both customers.
Step by Step Answer:
1 Exhibit 1217 shows the calculation of customer gross margin and customer cost to serve Exhibit 121...View the full answer


Introduction To Management Accounting
ISBN: 9780273737551
1st Edition
Authors: Alnoor Bhimani, Charles T. Horngren, Gary L. Sundem, William O. Stratton, Jeff Schatzberg
