

This case compares costvolumeprofit-based calculations to absorption-based costing profit figures. It deals also with standard costing problems.
Question:
This case compares cost–volume–profit-based calculations to absorption-based costing profit figures. It deals also with standard costing problems. The behavioural issues gain significance in assessing accounting figures validity.
‘I just don’t understand these financial statements at all!’, exclaimed Mrs Alma Spears.
Mrs Spears, who was approaching retirement, wished to turn over management of Fiddler Ltd, a division of UK Musical Supplies Plc, to her daughter, Linda, the following month. Fiddler Ltd manufactures toy stringed musical instruments (referred to by the generic term ‘fiddles’).
‘I am really proud of Linda’, she beamed. ‘She has shown us all the tricks she learned in business school and, if I say so myself, I firmly believe she is doing rather a good job for us. For example, she has put together this budget for Fiddler, which makes it really easy to see how much profit we’ll make at any sales volume (Figure 1). As far as I understand, in March we expected to have a volume of 8,000 units and a profit of £14,500 on our fiddles. But we did much better than that! We sold 10,000 fiddles, so we should have made almost £21,000 on them.’
‘Another one of Linda’s innovations is this standard cost system’, said Mrs Spears proudly.
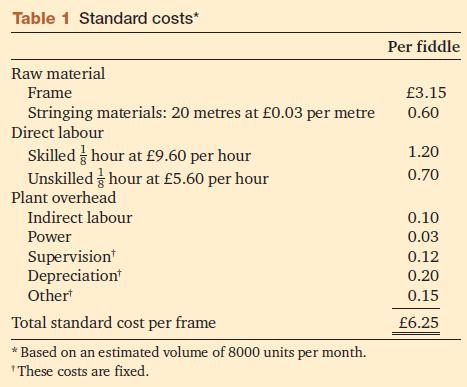
‘She sat down with our production people and came up with a standard production cost per unit (see Table 1). She says that this will tell us how well our production people are performing.
Also, she claims it will cut down on our clerical work.’
Figure 1
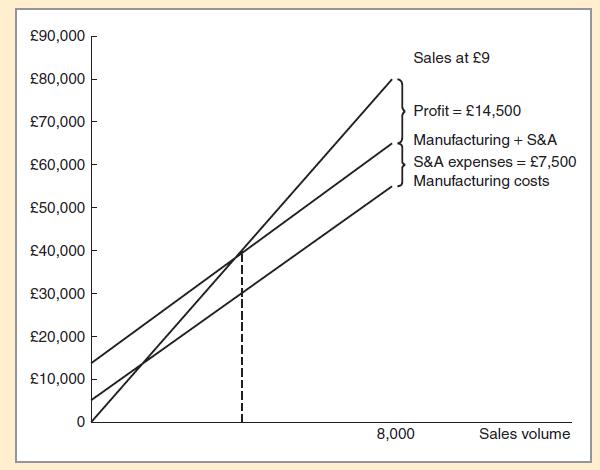
Table 1
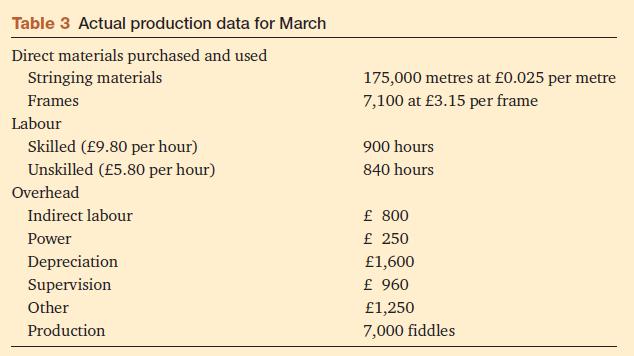
Mrs Spears continued, ‘But one thing puzzles me. My calculations show that we should have shown a profit of nearly £21,000 in March. However, our accountants came up with less than £19,000 in the monthly P&L ( Tables 2 and 3 ). This bothers me a great deal. Now I’m not sure whether the accountants are doing their job properly. It appears to me they’re about £2000 short.’As you can probably guess’, Mrs Spears concluded, ‘we are one big happy family around here.
I just wish I knew what those accountants are up to – coming in with a low profit figure like that.’
Table 2
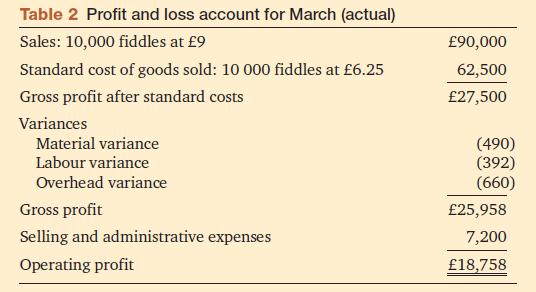
Table 3
Question
You are required to explain the discrepancy between the profit figures suggested by Linda’s profit graph and the accountant’s profit and loss account, showing all calculations.
Step by Step Answer:

This question has not been answered yet.
You can Ask your question!

Introduction To Management Accounting
ISBN: 9780273737551
1st Edition
Authors: Alnoor Bhimani, Charles T. Horngren, Gary L. Sundem, William O. Stratton, Jeff Schatzberg
